 Image 1 of 4
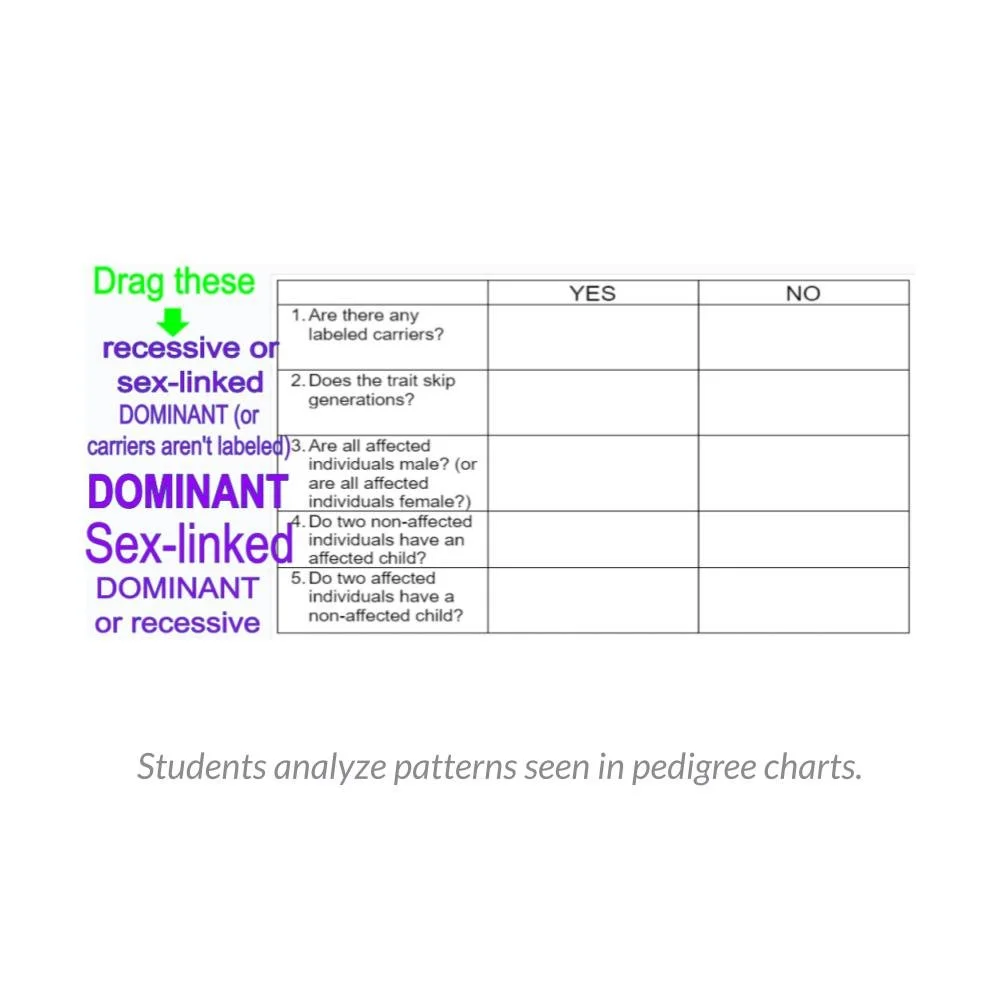 Image 2 of 4
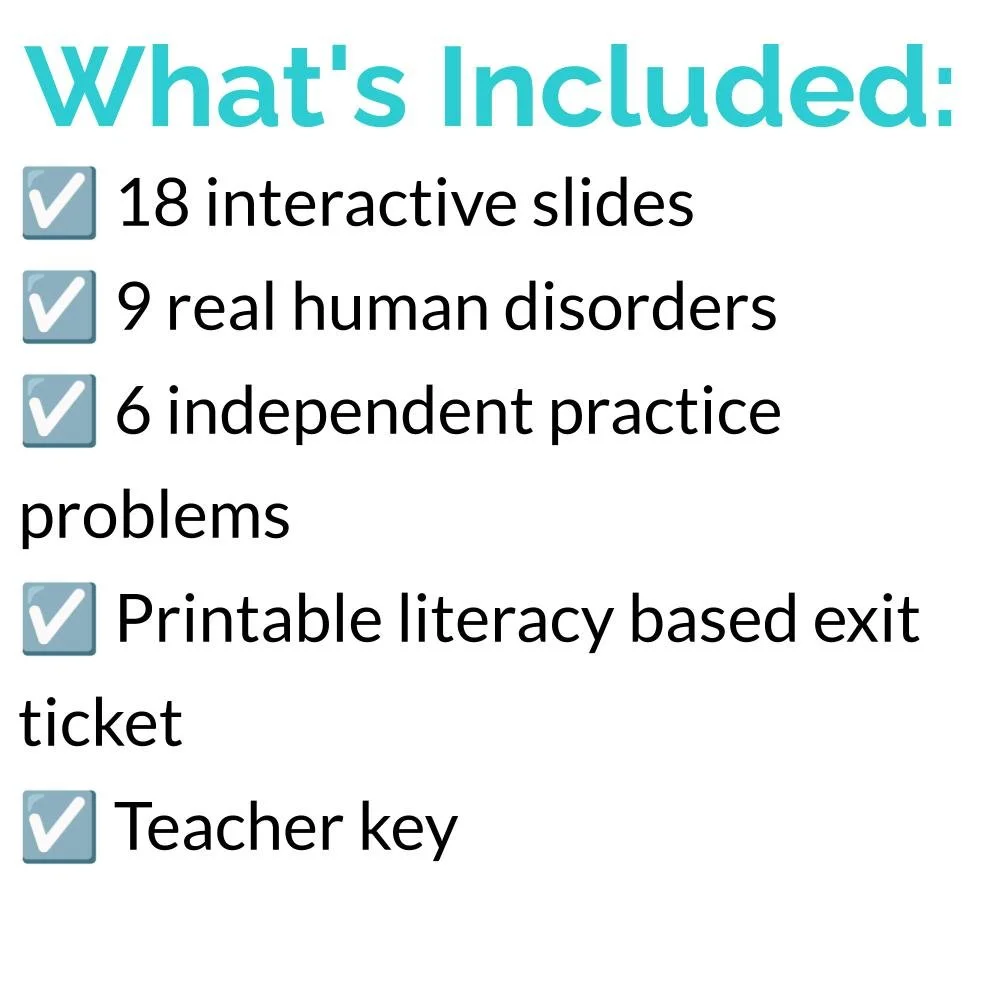 Image 3 of 4
 Image 4 of 4
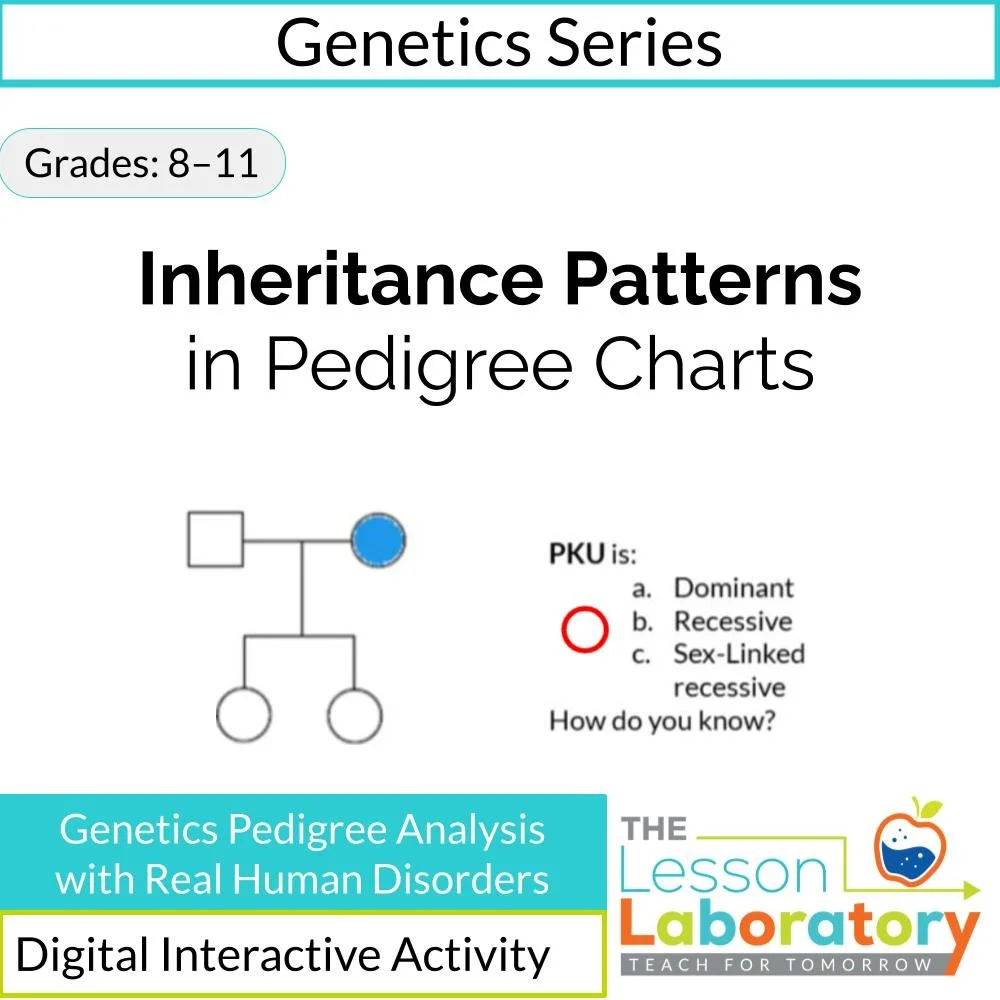
Students analyze real pedigree charts to determine inheritance patterns using evidence.
This interactive lesson develops student skill in interpreting pedigree charts by focusing on three inheritance patterns: dominant traits, recessive traits, and sex-linked recessive traits. All examples use real human conditions so students can connect abstract patterns to biological reality.
Students begin by examining three modeled traits:
ectrodactyly (dominant)
albinism (recessive)
color blindness (sex-linked recessive)
For each case, students mark key features directly on the pedigree to identify visual clues associated with each inheritance pattern. This process establishes a systematic method for analyzing pedigrees rather than relying on guesswork.
Students then:
complete a chart of diagnostic clues for each inheritance type
compare how different patterns appear across generations
practice applying these rules to new pedigrees
In the application phase, students analyze six additional pedigree charts showing different human traits and determine the most likely inheritance pattern for each case.
The lesson emphasizes:
recognition of generational patterns
use of evidence from family data
distinction between autosomal and sex-linked inheritance
structured reasoning about genotype and phenotype
This lesson is designed to support:
mastery of pedigree interpretation
understanding of inheritance mechanisms
application of genetics concepts to real cases
preparation for more advanced genetic analysis
It functions well as:
a core lesson on pedigrees
a guided practice activity
or a reinforcement lesson within a heredity unit
NGSS Alignment (High School):
HS-LS3-1, HS-LS3-2, HS-LS3-3
NGSS Alignment (Middle School):
MS-LS3-1, MS-LS3-2
Science & Engineering Practices (SEPs):
Developing and Using Models; Analyzing and Interpreting Data; Constructing Explanations
Crosscutting Concepts (CCCs):
Patterns; Cause and Effect; Structure and Function
Common Core (Literacy in Science):
RST.9-10.4, RST.11-12.4
RST.9-10.7, RST.11-12.7
WHST.9-10.2, WHST.11-12.2
Bundle Upgrade Policy
This lesson is included in one or more bundles. To support flexible purchasing and long-term use of our curriculum, Lesson Laboratory offers a bundle upgrade policy.
If you purchase this lesson and decide at a later date that you would like to upgrade to a bundle, you may request a store credit equal to the total amount paid for duplicate items.
To request an upgrade credit, please email thelessonlaboratory@gmail.com and include:
Your username
The order numbers for both the original purchase(s) and the bundle
The names of the duplicate resources
Requests must be submitted within 30 days of the bundle purchase. Credits are issued as store credit for future Lesson Laboratory purchases and are not provided as cash refunds.
This policy applies only to purchases of resources that are later included in a Lesson Laboratory bundle and is limited to one adjustment per upgrade pathway.