 Image 1 of 4
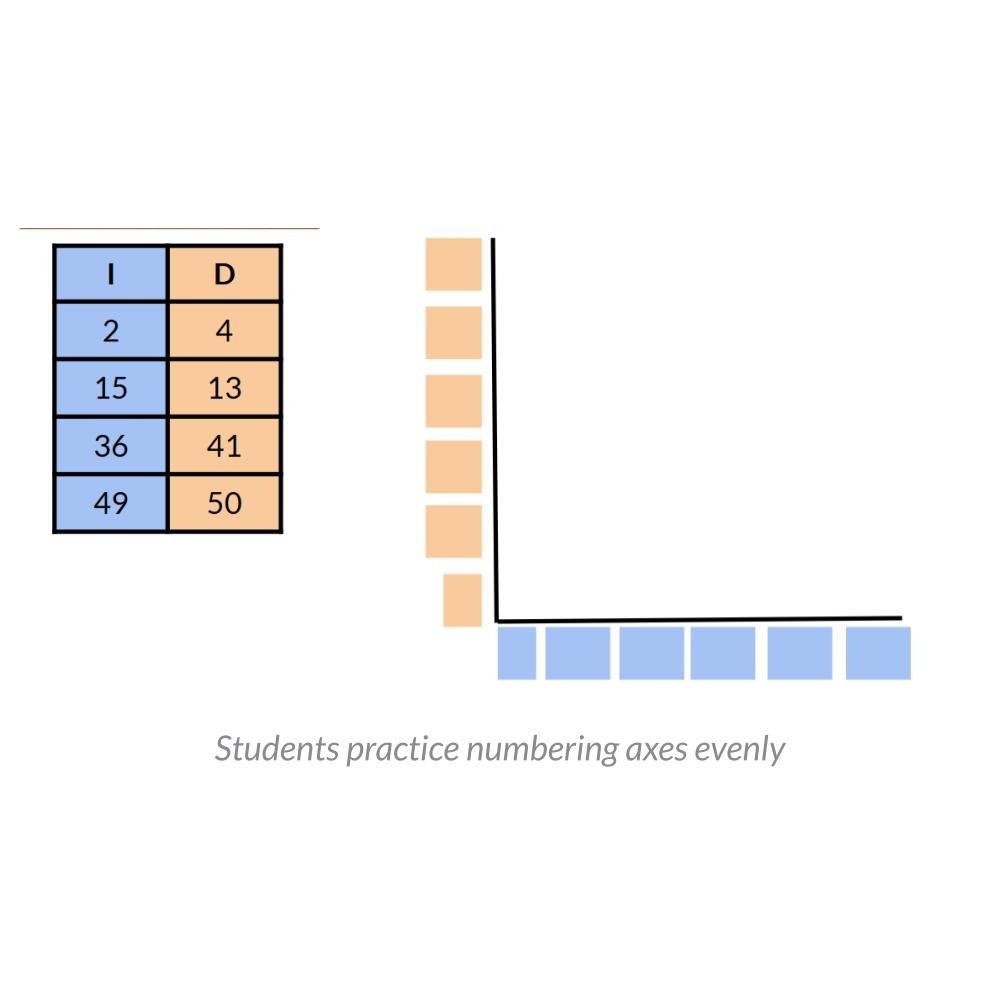 Image 2 of 4
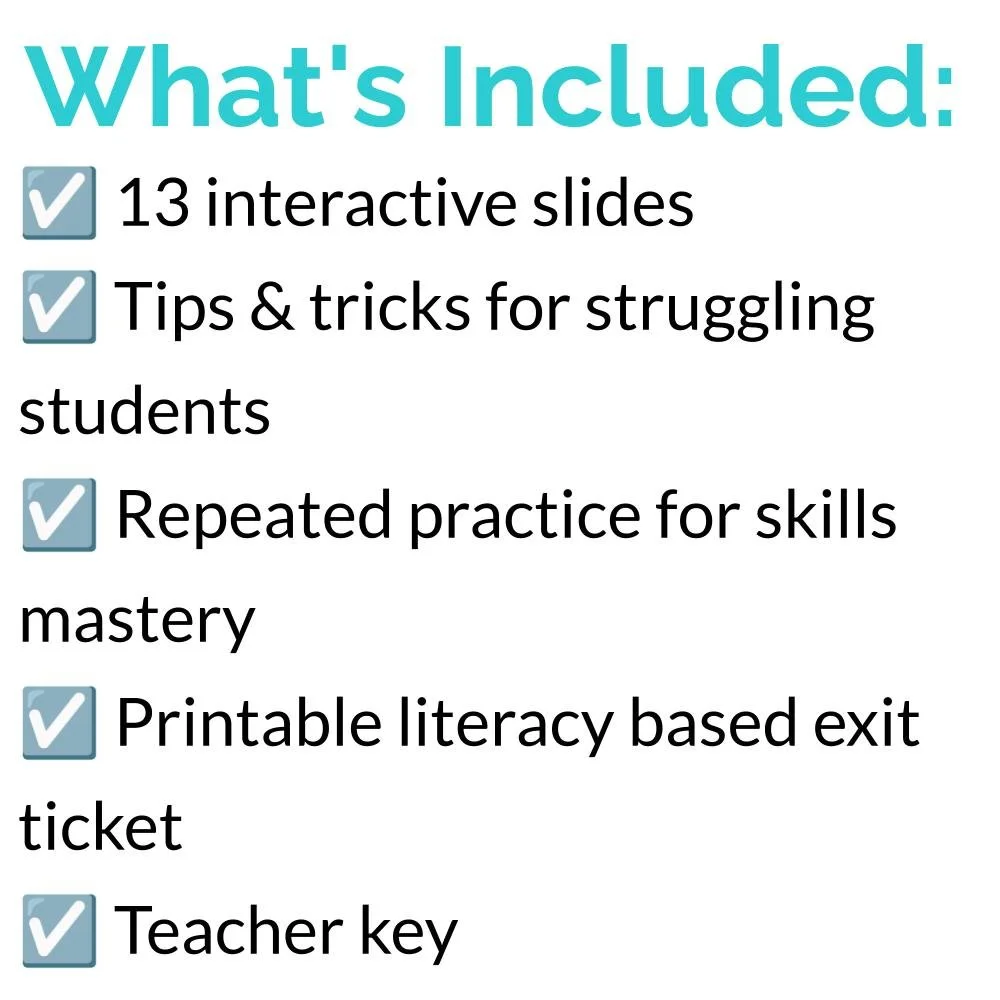 Image 3 of 4
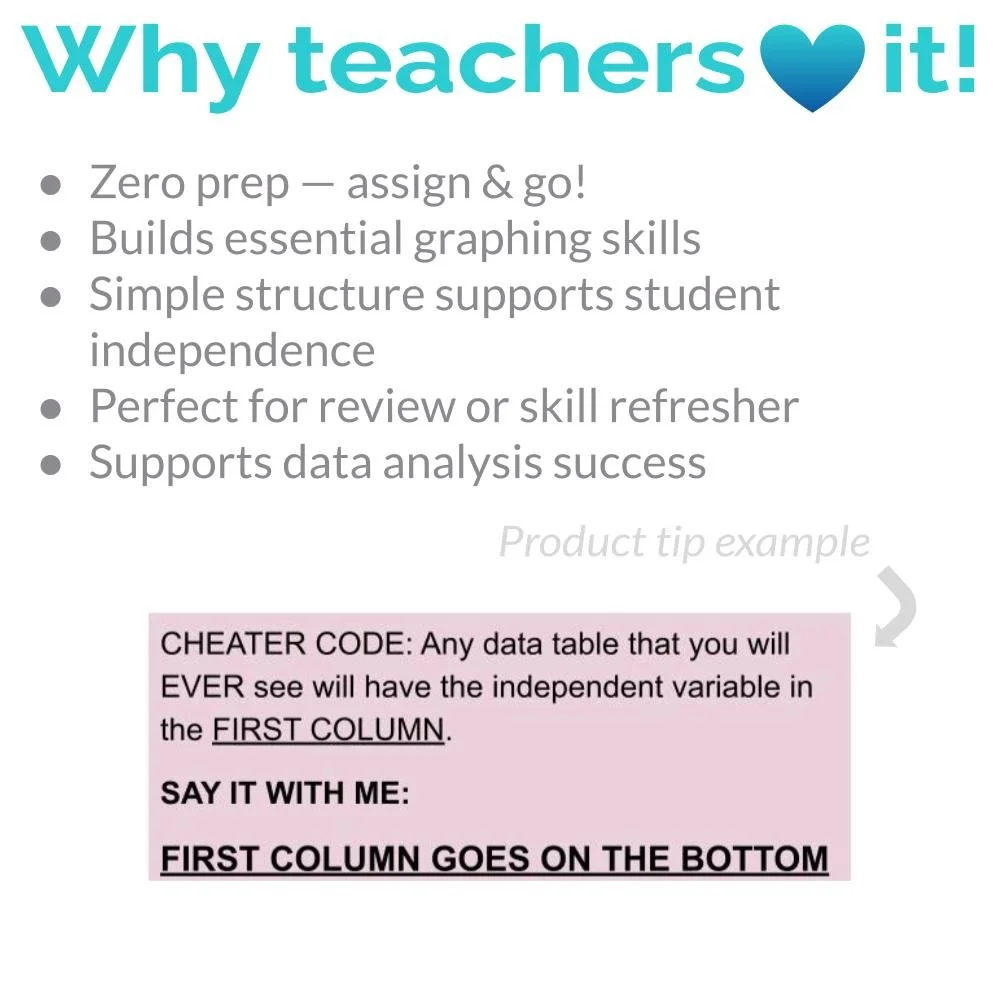 Image 4 of 4
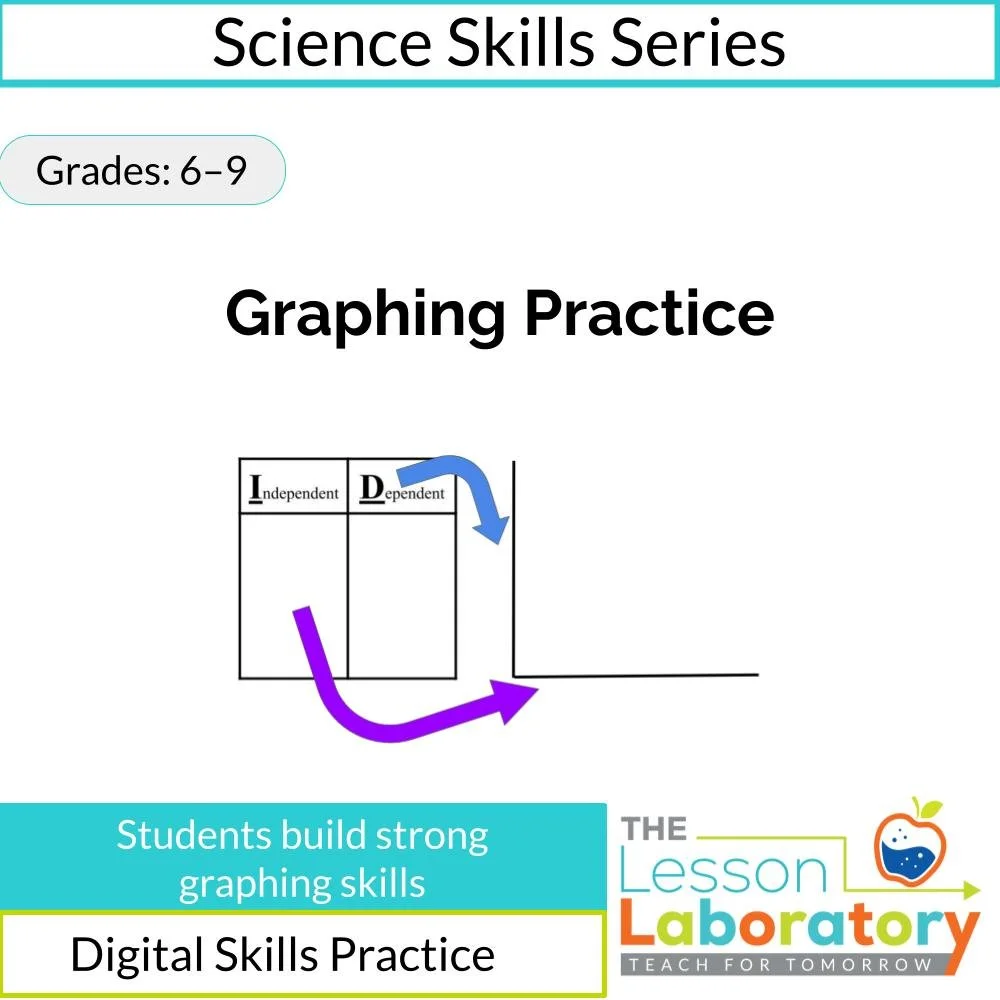
Graphing Practice Activity | Independent & Dependent Variables Review.
This interactive lesson develops student understanding of two foundational graphing conventions: correct placement of the independent variable and accurate, evenly spaced axis labeling. Students work through structured examples and editable practice slides to apply these rules consistently.
Students focus on:
identifying the independent variable in a data table
placing the independent variable on the x-axis
labeling axes with evenly spaced numerical values
checking graphs for accuracy and clarity
The editable practice slides allow teachers to customize data sets and difficulty while maintaining a consistent instructional structure.
This lesson is designed to support:
correct construction of scientific graphs
reduction of common graphing errors
consistent use of graphing conventions across labs and activities
transfer of graphing skills to other science units
It functions well as:
an introductory graphing lesson
a targeted intervention for graphing errors
a skills-focused practice activity within a science skills sequence
The digital format allows for low-prep implementation while emphasizing precision and procedural understanding.
To preview this lesson, click here.
Science & Engineering Practices (SEPs):
Analyzing and Interpreting Data; Using Mathematics and Computational Thinking
Crosscutting Concepts (CCCs):
Patterns; Scale, Proportion, and Quantity
Common Core (Literacy in Science):
RST.6-8.3, RST.9-10.3
RST.6-8.7, RST.9-10.7
Common Core (Mathematics):
6.SP.B.4