 Image 1 of 4
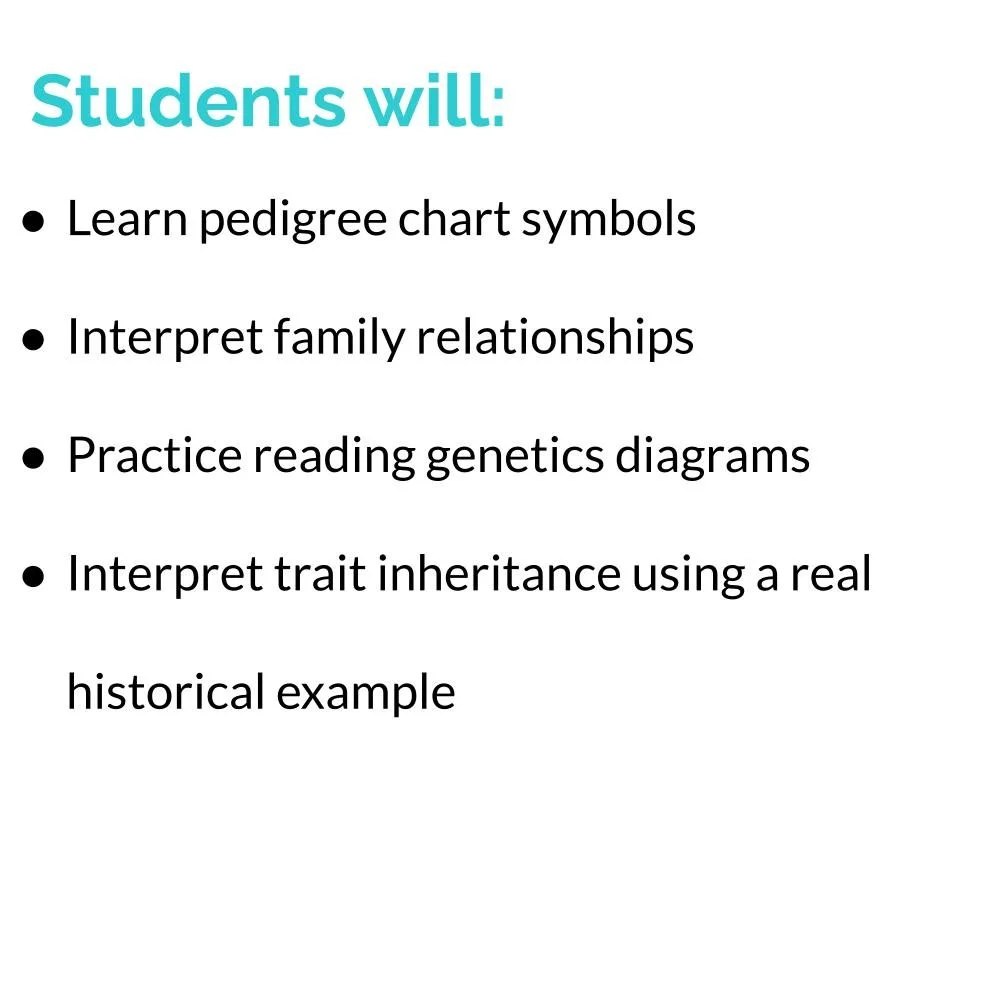 Image 2 of 4
 Image 3 of 4
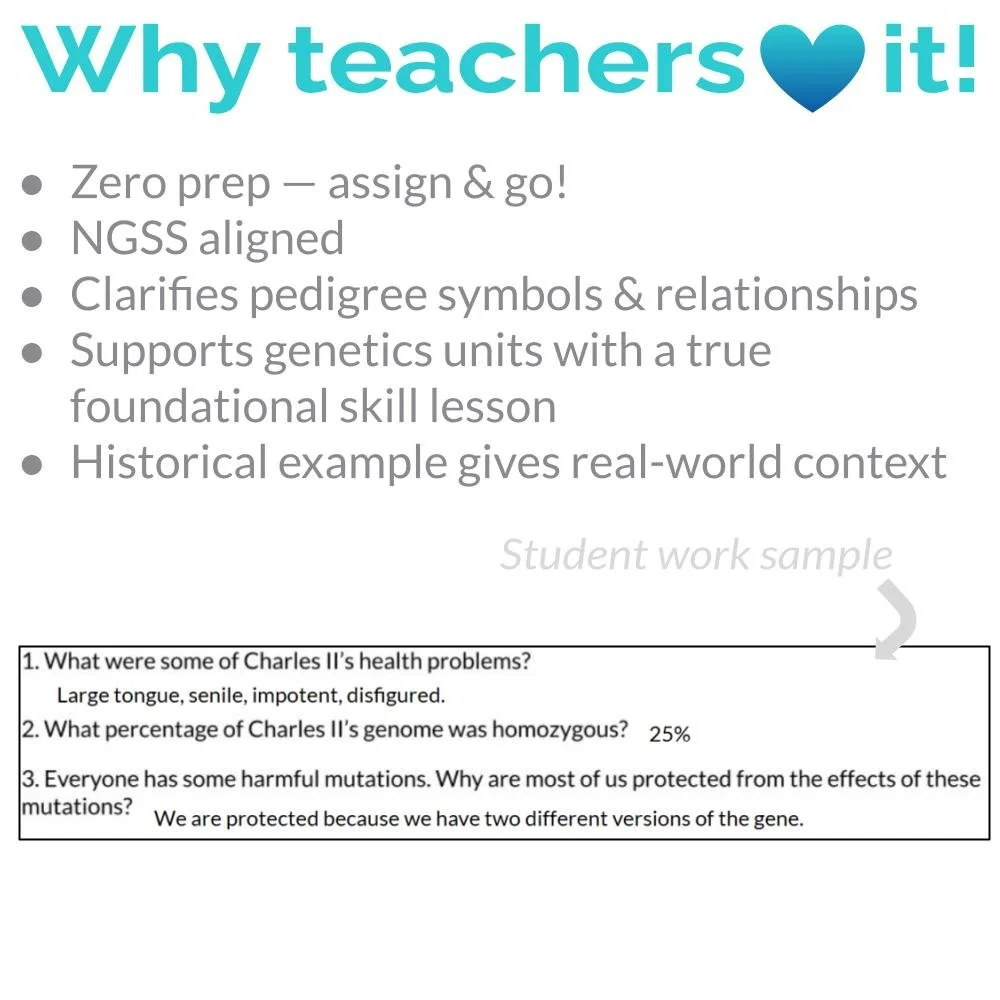 Image 4 of 4
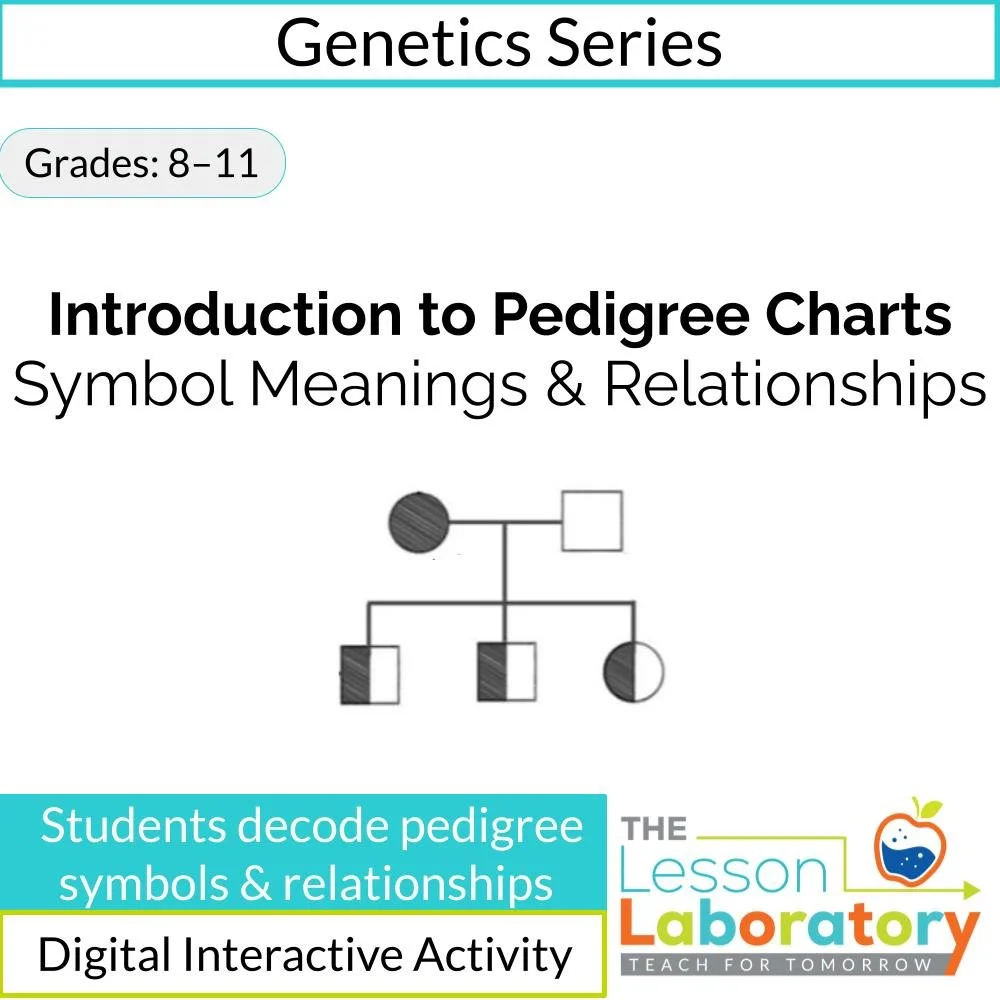
Foundational Genetics Skill Lesson for Reading Pedigrees.
This lesson introduces students to the basic structure and purpose of pedigree charts by first grounding them in essential genetics vocabulary. Students review and apply terms such as gene vs. allele, genotype vs. phenotype, and homozygous vs. heterozygous. A brief self-check allows students to identify areas where they need reinforcement, with optional linked review available for targeted practice.
Students are then introduced to the concept of a carrier and examine why carriers must be heterozygous for recessive traits. This prepares them to interpret information presented in pedigree charts accurately.
The lesson moves into explicit instruction on pedigree chart symbols and how relationships are represented. Students practice identifying individuals, family connections, and affected versus unaffected members within a pedigree before moving on to more complex interpretation tasks.
To apply these skills in context, students analyze a historical pedigree connected to Charles II of Spain. Using this example, they interpret relationships and trait patterns to explain how inheritance contributed to the end of his lineage. This provides a real-world case for applying genetics vocabulary and pedigree-reading skills.
This lesson is designed to function as a foundational pedigree-reading lesson prior to inheritance pattern analysis. It builds the representational literacy students need before tackling dominant, recessive, or sex-linked trait determination.
To preview this lesson, click here.
NGSS Alignment (High School):
HS-LS3-1, HS-LS3-2, HS-LS3-3
NGSS Alignment (Middle School):
MS-LS3-1, MS-LS3-2
Science & Engineering Practices (SEPs):
Developing and Using Models; Analyzing and Interpreting Data; Constructing Explanations
Crosscutting Concepts (CCCs):
Patterns; Cause and Effect; Structure and Function
Common Core (Literacy in Science):
RST.9-10.4, RST.11-12.4
RST.9-10.7, RST.11-12.7
WHST.9-10.2, WHST.11-12.2
Bundle Upgrade Policy
This lesson is included in one or more bundles. To support flexible purchasing and long-term use of our curriculum, Lesson Laboratory offers a bundle upgrade policy.
If you purchase this lesson and decide at a later date that you would like to upgrade to a bundle, you may request a store credit equal to the total amount paid for duplicate items.
To request an upgrade credit, please email thelessonlaboratory@gmail.com and include:
Your username
The order numbers for both the original purchase(s) and the bundle
The names of the duplicate resources
Requests must be submitted within 30 days of the bundle purchase. Credits are issued as store credit for future Lesson Laboratory purchases and are not provided as cash refunds.
This policy applies only to purchases of resources that are later included in a Lesson Laboratory bundle and is limited to one adjustment per upgrade pathway.