 Image 1 of 4
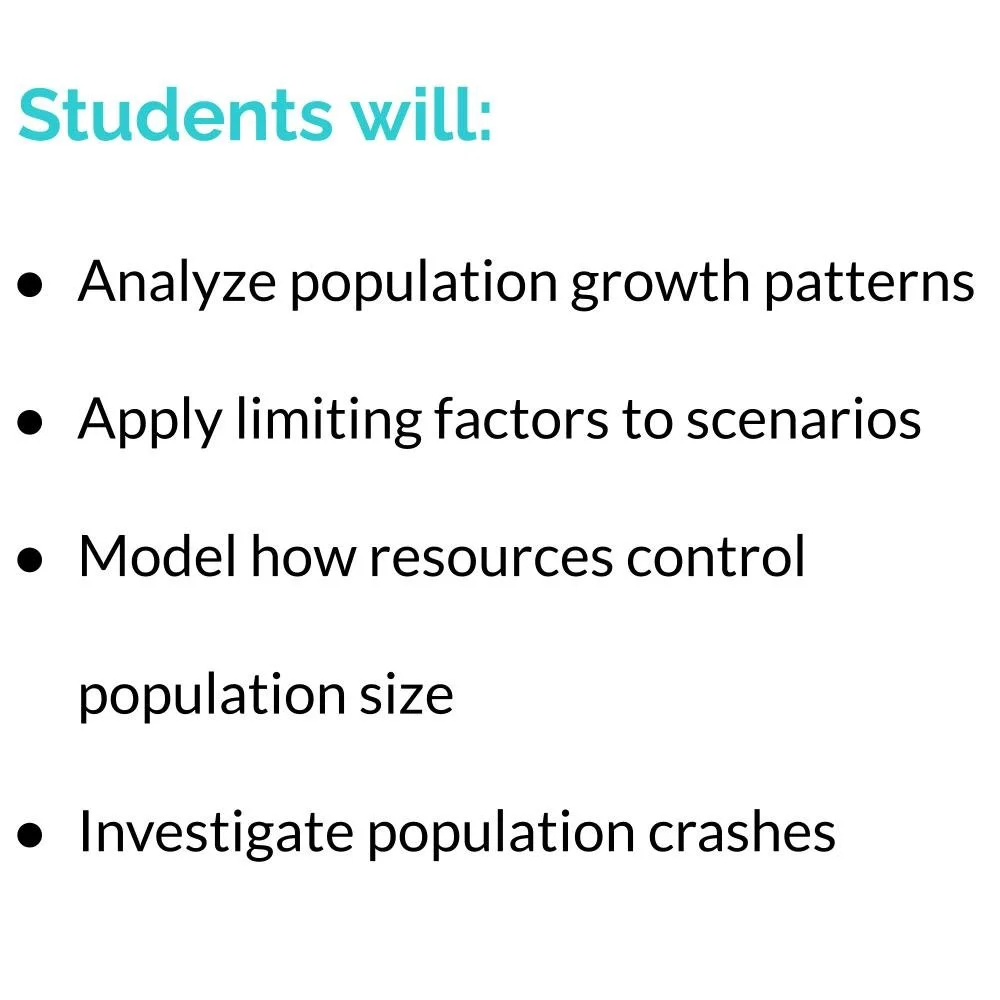 Image 2 of 4
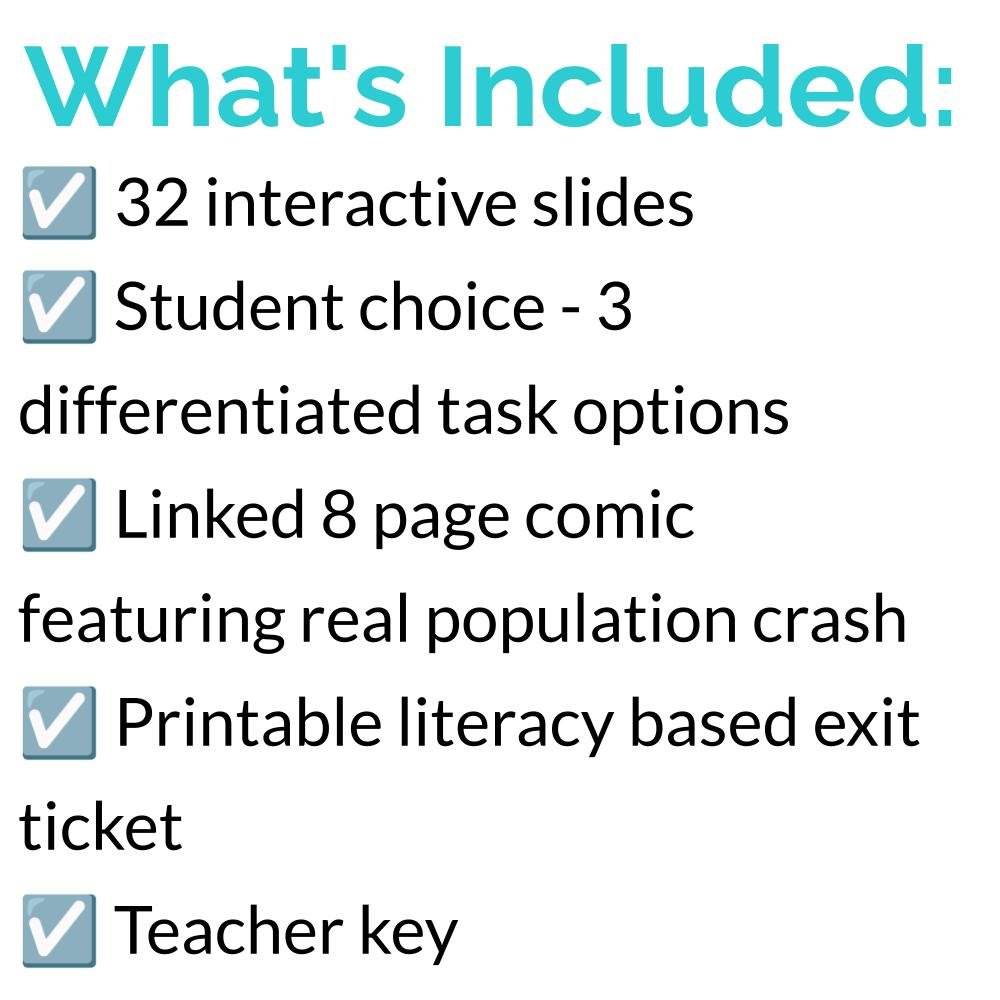 Image 3 of 4
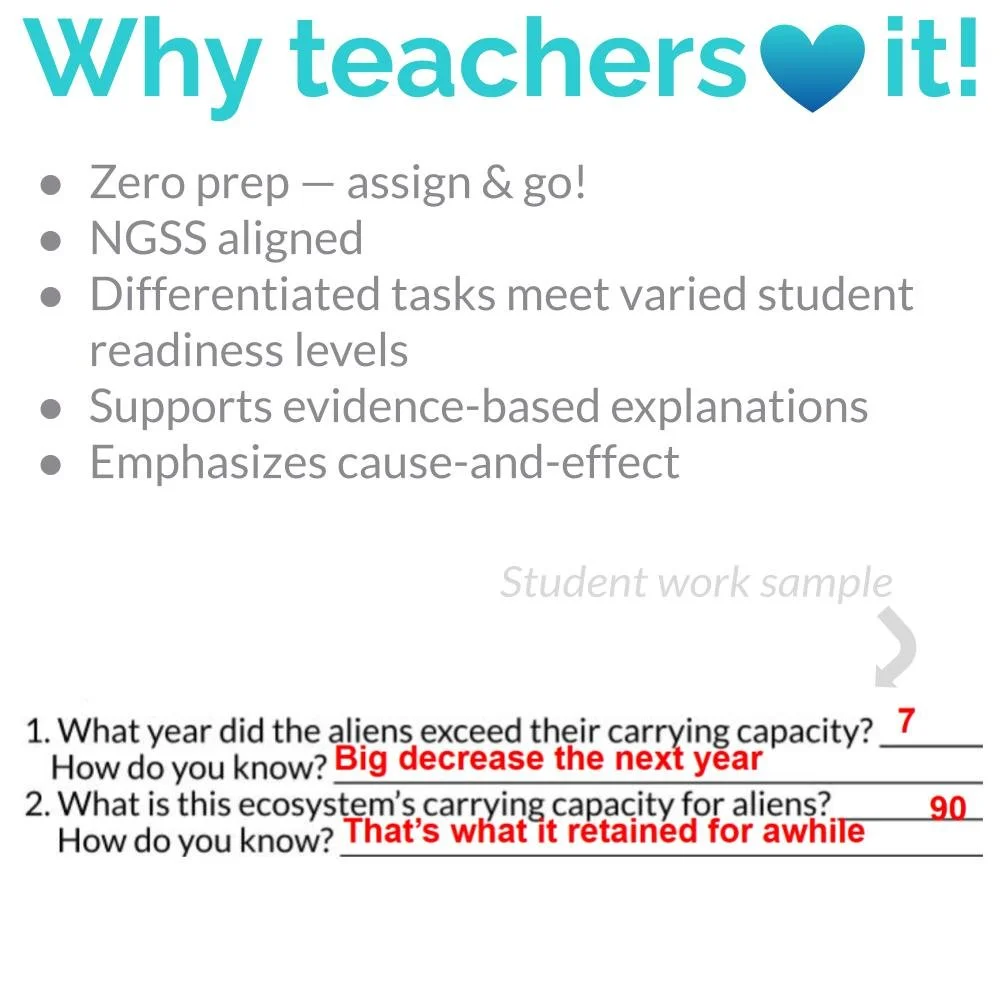 Image 4 of 4
Population Ecology Investigation with Differentiated Student Tasks.
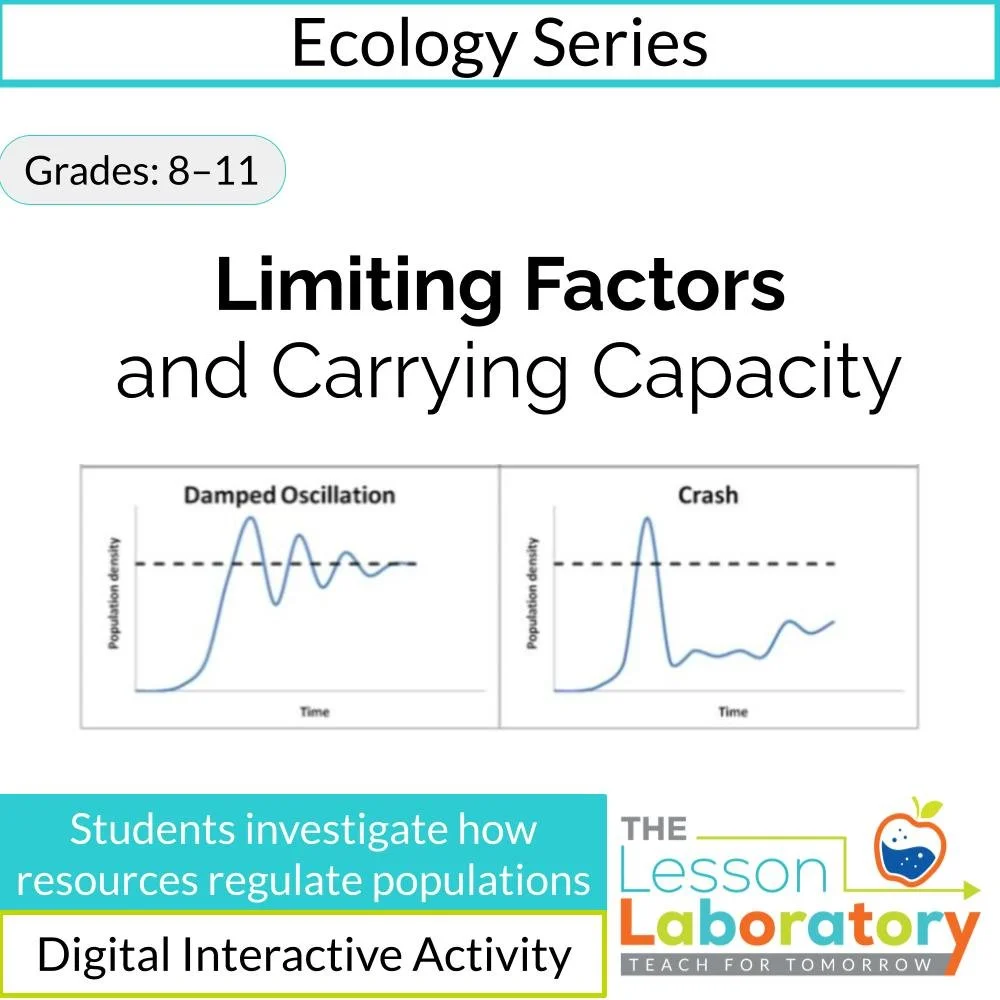
This digital lesson introduces students to how limiting factors regulate population size and how carrying capacity emerges from resource constraints. Students work through guided notes and structured analysis before applying these ideas through a differentiated task choice.
Students begin by examining population growth patterns and the role of food, water, space, and other environmental factors. They compare exponential and logistic growth and connect these models to real ecological outcomes. Throughout the lesson, emphasis is placed on cause-and-effect relationships between resource availability and population change.
To complete the lesson, students choose one of three task options based on readiness:
A structured practice pathway focused on identifying limiting factors and predicting population outcomes
A case-based analysis using the St. Matthew Island reindeer population to explain a real-world population crash
A simulation-style investigation in which students test how changing resources alters population stability
All pathways require students to use evidence to explain how limiting factors determine carrying capacity and why populations stabilize or collapse.
This lesson is designed to support:
Conceptual understanding of population regulation
Application of ecological models to real scenarios
Evidence-based explanation rather than vocabulary recall
It functions well as a core population ecology lesson or as an anchor activity within an ecology unit. The digital format allows for low-prep implementation while preserving cognitive rigor and student choice.
To preview this lesson, click here.
NGSS Alignment (High School):
HS-LS2-1, HS-LS2-2
NGSS Alignment (Middle School):
MS-LS2-1, MS-LS2-2, MS-LS2-4
Science & Engineering Practices (SEPs):
Analyzing and Interpreting Data
Constructing Explanations
Engaging in Argument from Evidence
Crosscutting Concepts (CCCs):
Cause and Effect
Systems and System Models
Stability and Change
Common Core (Literacy in Science):
CCSS.ELA-LITERACY.RST.6-8.2 / RST.9-10.2; CCSS.ELA-LITERACY.RST.6-8.7 / RST.9-10.7
Population Ecology Investigation with Differentiated Student Tasks.
This digital lesson introduces students to how limiting factors regulate population size and how carrying capacity emerges from resource constraints. Students work through guided notes and structured analysis before applying these ideas through a differentiated task choice.
Students begin by examining population growth patterns and the role of food, water, space, and other environmental factors. They compare exponential and logistic growth and connect these models to real ecological outcomes. Throughout the lesson, emphasis is placed on cause-and-effect relationships between resource availability and population change.
To complete the lesson, students choose one of three task options based on readiness:
A structured practice pathway focused on identifying limiting factors and predicting population outcomes
A case-based analysis using the St. Matthew Island reindeer population to explain a real-world population crash
A simulation-style investigation in which students test how changing resources alters population stability
All pathways require students to use evidence to explain how limiting factors determine carrying capacity and why populations stabilize or collapse.
This lesson is designed to support:
Conceptual understanding of population regulation
Application of ecological models to real scenarios
Evidence-based explanation rather than vocabulary recall
It functions well as a core population ecology lesson or as an anchor activity within an ecology unit. The digital format allows for low-prep implementation while preserving cognitive rigor and student choice.
To preview this lesson, click here.
NGSS Alignment (High School):
HS-LS2-1, HS-LS2-2
NGSS Alignment (Middle School):
MS-LS2-1, MS-LS2-2, MS-LS2-4
Science & Engineering Practices (SEPs):
Analyzing and Interpreting Data
Constructing Explanations
Engaging in Argument from Evidence
Crosscutting Concepts (CCCs):
Cause and Effect
Systems and System Models
Stability and Change
Common Core (Literacy in Science):
CCSS.ELA-LITERACY.RST.6-8.2 / RST.9-10.2; CCSS.ELA-LITERACY.RST.6-8.7 / RST.9-10.7