 Image 1 of 4
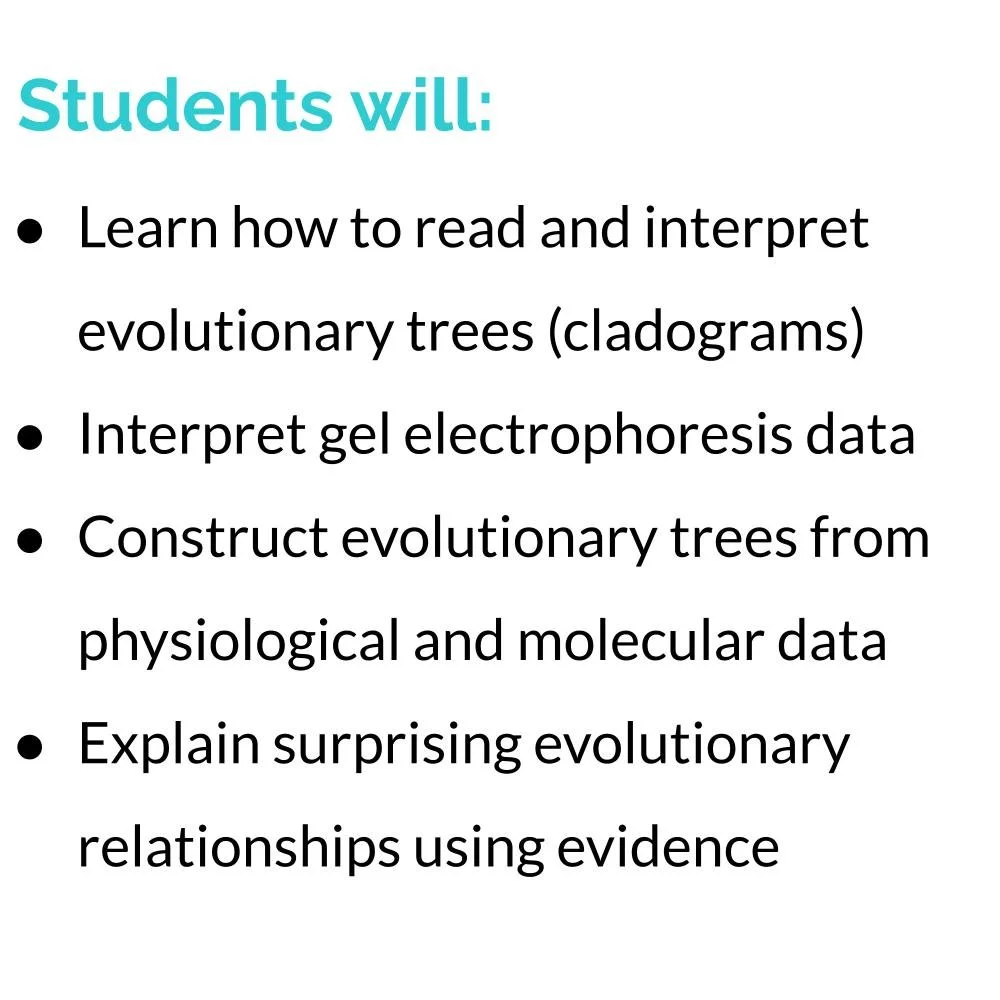 Image 2 of 4
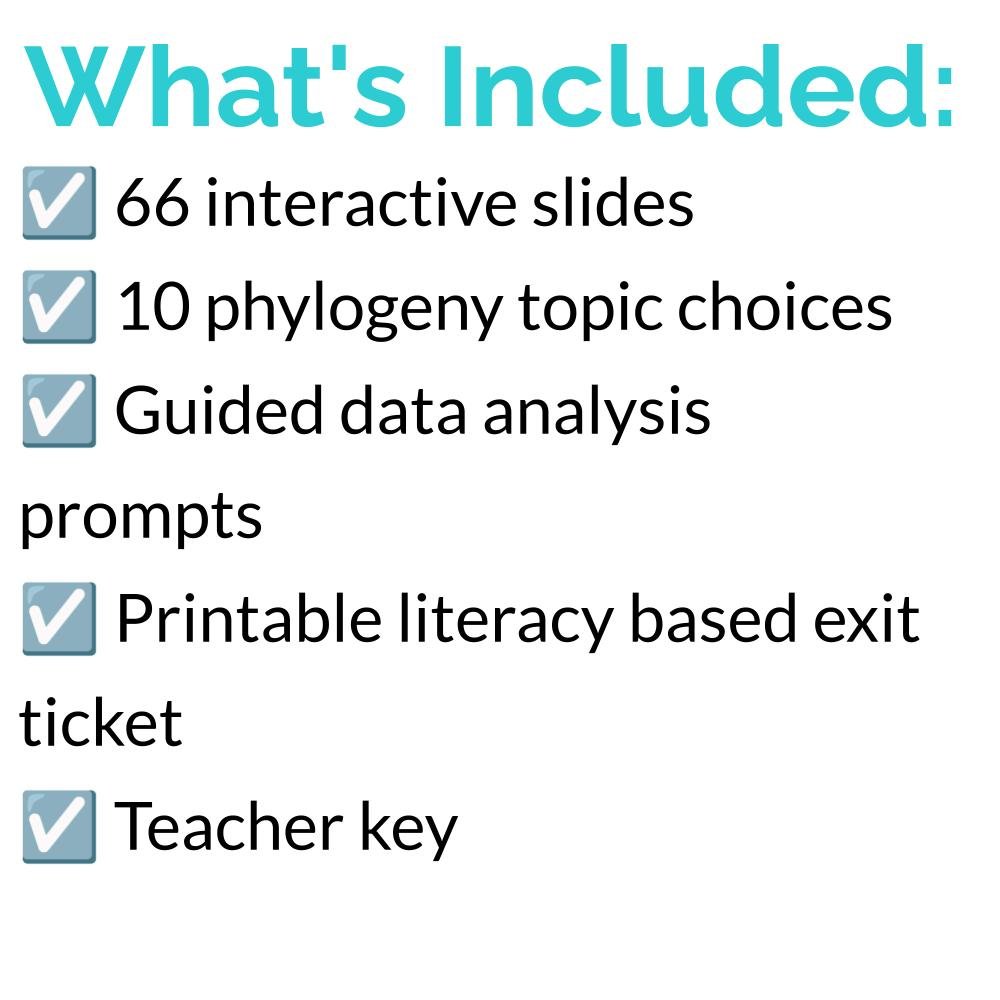 Image 3 of 4
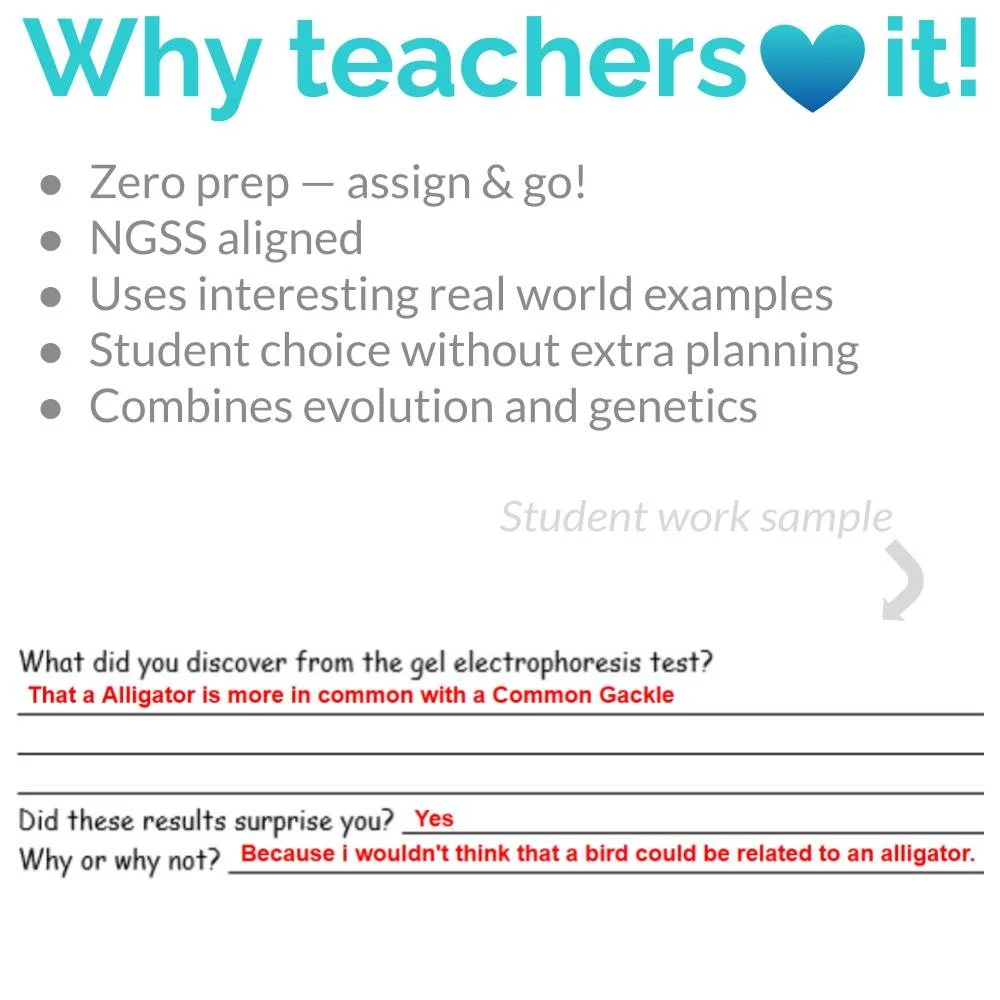 Image 4 of 4
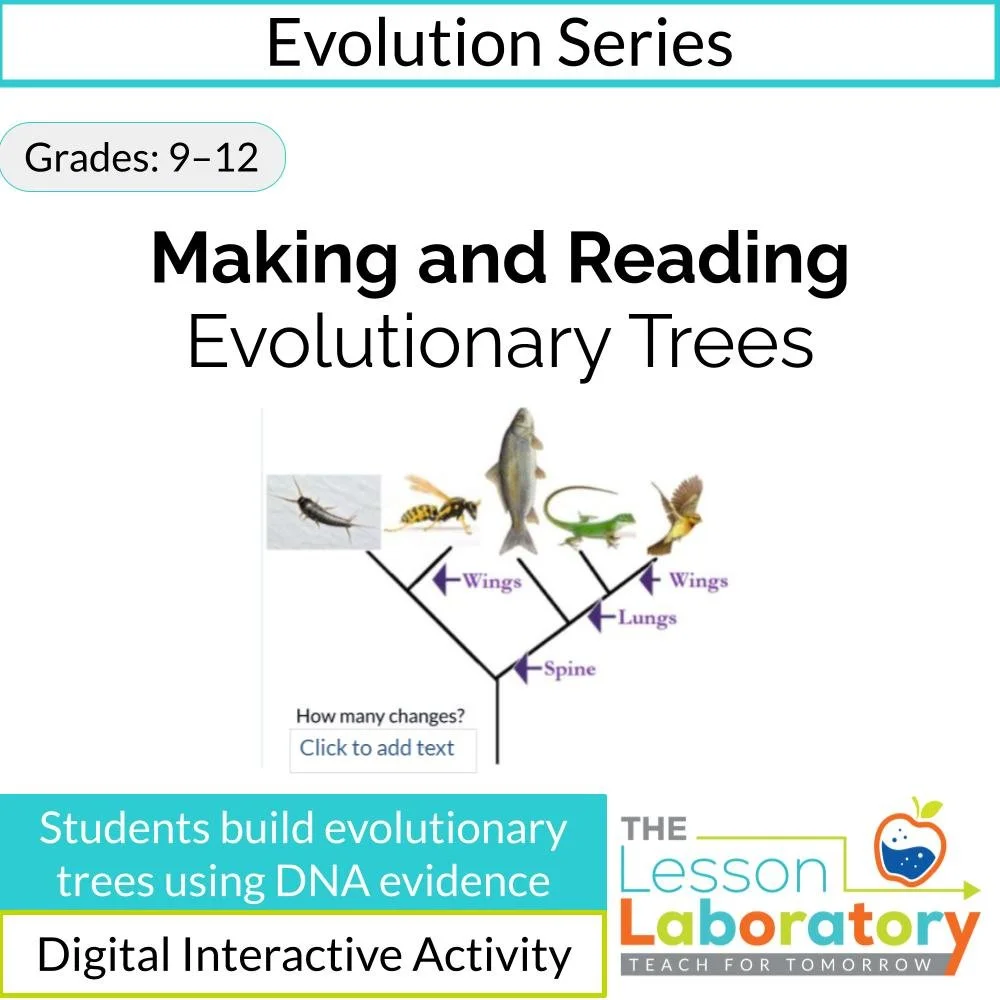
Interactive Google Slides lesson where students construct and analyze evolutionary trees using real species evidence.
This interactive Google Slides lesson teaches students how to both read and construct evolutionary trees (cladograms) using real biological and molecular evidence. Students move beyond memorizing tree conventions and instead learn how scientists infer evolutionary relationships from data.
Students begin by connecting evolutionary trees to familiar family trees, establishing the idea that both represent patterns of relatedness over time. They learn the core rules and conventions of cladograms and practice interpreting branching relationships and common ancestry.
The lesson then introduces the role of genetic evidence in evolutionary classification. Students examine how DNA comparisons can reveal relationships that are not obvious from appearance alone, including a case study on divergence between closely related species.
Next, students learn how scientists use the principle of parsimony to construct evolutionary trees. Through guided practice, they evaluate multiple possible trees and determine which best explains the data with the fewest evolutionary changes. Students build trees collaboratively and independently using provided organism data sets.
The culminating portion of the lesson is a choice-based investigation. Students select one of ten organism sets and use gel electrophoresis results to construct a DNA-based evolutionary tree. Before analyzing the molecular data, students make predictions based on visible traits, then revise their conclusions using genetic evidence. Each investigation reveals a surprising evolutionary relationship, reinforcing the power of molecular data in modern biology.
This lesson supports students in:
Reading and interpreting cladograms
Applying the principle of parsimony
Using molecular evidence to infer common ancestry
Comparing trait-based and DNA-based classification
Explaining evolutionary relationships with evidence
With built-in differentiation through student choice and multiple investigation pathways, this lesson works well as a core evolution application activity or an advanced evidence-based extension. It provides students with authentic experience using data to reconstruct evolutionary history rather than simply being told what the relationships are.
To see a preview of this lesson, click here.
NGSS Alignment (High School):
HS-LS4-1; HS-LS4-2; HS-LS4-4
Science & Engineering Practices (SEPs):
Developing and Using Models
Analyzing and Interpreting Data
Constructing Explanations
Engaging in Argument from Evidence
Crosscutting Concepts (CCCs):
Systems and System Models
Patterns
Stability and Change
Common Core (Literacy in Science):
CCSS.ELA-LITERACY.RST.9-10.1; CCSS.ELA-LITERACY.RST.RST.9-10.7; CCSS.ELA-LITERACY.WHST.WHST.9-10.1; CCSS.ELA-LITERACY.WHST.WHST.9-10.9
Bundle Upgrade Policy
This lesson is included in one or more bundles. To support flexible purchasing and long-term use of our curriculum, Lesson Laboratory offers a bundle upgrade policy.
If you purchase this lesson and decide at a later date that you would like to upgrade to a bundle, you may request a store credit equal to the total amount paid for duplicate items.
To request an upgrade credit, please email thelessonlaboratory@gmail.com and include:
Your username
The order numbers for both the original purchase(s) and the bundle
The names of the duplicate resources
Requests must be submitted within 30 days of the bundle purchase. Credits are issued as store credit for future Lesson Laboratory purchases and are not provided as cash refunds.
This policy applies only to purchases of resources that are later included in a Lesson Laboratory bundle and is limited to one adjustment per upgrade pathway.